Unlocking the Power of Browser Developer Tools: Tips and Tricks
Learn how to harness the full potential of browser developer tools, including Chrome DevTools, to debug and optimize your web applications effectively. Discover tips and tricks for maximizing efficiency in Firefox, Safari, and more.

Are you looking to perfect your web projects? Want to know the secrets behind web development and debugging? In this comprehensive guide, we'll explore the world of browser developer tools and provide you with essential tips and tricks to maximize your workflow. Whether you're a web developer or simply curious about how websites work, these tools will revolutionize the way you approach web development. So, are you ready to dive into the world of browser developer tools and unlock their true power?
Key Takeaways:
- Browser developer tools are essential for web developers looking to perfect their projects.
- Understanding and utilizing browser developer tools can greatly enhance productivity in web development.
- These tools offer a range of capabilities, from inspecting and editing CSS to debugging JavaScript code.
- With browser developer tools, you can analyze website performance and optimize your web pages.
- Stay up-to-date with the latest features and updates to make the most of browser developer tools.
What are browser developer tools?
Browser developer tools, also known as devtools, are a suite of powerful tools integrated into every modern web browser. These tools allow developers and web designers to inspect, debug, and modify web pages in real-time.
They provide a deep level of insight into the structure, performance, and behavior of websites, making them indispensable for professionals in the field. Each browser has its own set of developer tools, but in this guide, we'll primarily focus on Chrome Developer Tools, as it is widely used and offers robust functionality.
5 common uses of Chrome Developer Tools
Chrome Developer Tools provide a wide range of capabilities that can greatly enhance your web development workflow. Whether you are a seasoned developer or just starting out, understanding these common uses of Chrome Developer Tools is essential. Let's explore the five key functionalities that every web developer should be familiar with:
- Inspecting and Modifying Elements: With Chrome Developer Tools, you can easily inspect and modify elements on a web page. This feature allows you to experiment with different styles and layouts, making it a valuable tool for fine-tuning your designs.
- Viewing and Modifying CSS Styles: The CSS Styles panel in Chrome Developer Tools enables you to view and modify the CSS styles applied to specific elements. This functionality allows you to make real-time changes to the appearance of your web page.
- Testing and Debugging JavaScript Code: The JavaScript Console provides a powerful environment for software testing services and debugging JavaScript code. With Chrome Developer Tools, you can easily identify and fix any errors or issues in your JavaScript code.
- Analyzing Network Requests: The Network panel allows you to analyze network requests made by your web page. This feature is invaluable for optimizing website performance and identifying any bottlenecks in your network traffic.
- Optimizing Performance: The Performance panel in Chrome Developer Tools helps you identify and resolve performance issues in your web page. By analyzing the performance metrics, you can optimize your code and ensure a smooth browsing experience for your users.
By leveraging these common uses of Chrome Developer Tools, you can streamline your web development process, debug code effectively, and optimize your website's performance. Make the most out of these powerful tools to create exceptional web projects.
How to open browser Developer Tools on your desktop browser
Opening browser developer tools on your desktop browser is a simple process that allows you to access the powerful features they offer. Here's how to open developer tools in popular browsers:
Google Chrome:
Right-click on a web page and select "Inspect" from the context menu. Alternatively, use the keyboard shortcut Ctrl+Shift+I (Windows) or Cmd+Option+I (Mac).
Mozilla Firefox:
Right-click on a web page and select "Inspect Element" from the context menu. Alternatively, use the keyboard shortcut Ctrl+Shift+C (Windows) or Cmd+Option+C (Mac).
Apple Safari:
Go to the Safari menu, select "Preferences," and navigate to the "Advanced" tab. Check the box next to "Show Develop menu in menu bar." Then, click on "Develop" in the menu bar and select "Show Web Inspector."
Microsoft Edge:
Right-click on a web page and select "Inspect" from the context menu. Alternatively, use the keyboard shortcut Ctrl+Shift+I (Windows) or Cmd+Option+I (Mac).
Once opened, the browser developer tools will appear as a panel within the browser window. From there, you can interact with the underlying web page and utilize the various tools and features to enhance your web development workflow.
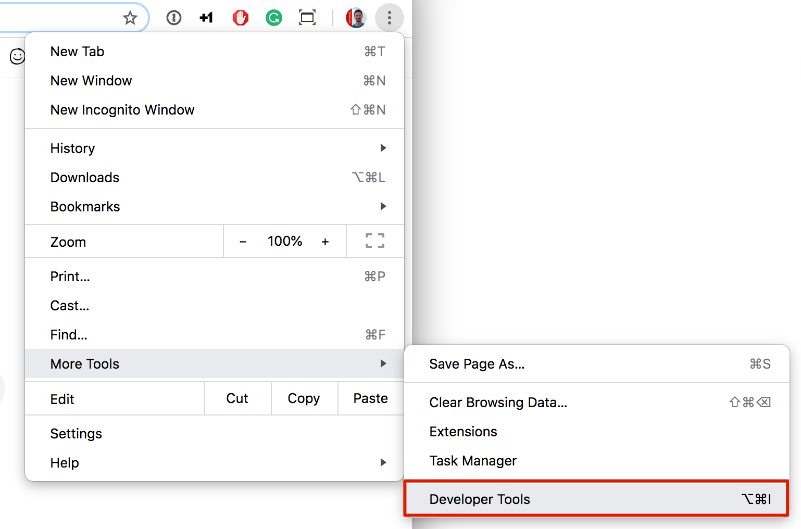
How to open browser Developer Tools on mobile
Opening browser developer tools on a mobile browser is slightly different from the desktop experience. Each mobile browser has its own unique method for accessing these tools. Here's how you can open developer tools on two popular mobile browsers: Chrome and Safari.
Opening Browser Developer Tools on Chrome for Mobile:
- Tap the three-dot menu in the top-right corner of the Chrome browser.
- Select "More Tools" from the menu options.
- Choose "Developer Tools" from the additional options.
Opening Browser Developer Tools on Safari for iOS:
- First, you need to enable the "Develop" menu in Safari settings on your iOS device.
- Once enabled, connect your iOS device to a Mac computer.
- On the Mac, open Safari and go to the Safari menu.
- Under the "Develop" submenu, you'll find a list of available devices with their corresponding web pages.
- Select the device and web page you want to inspect and debug.
These browser developer tools are invaluable for mobile development and testing. With the ability to inspect and debug responsive designs, analyze network requests, and simulate various device conditions, you can ensure your websites are optimized for mobile viewing and provide an excellent user experience.
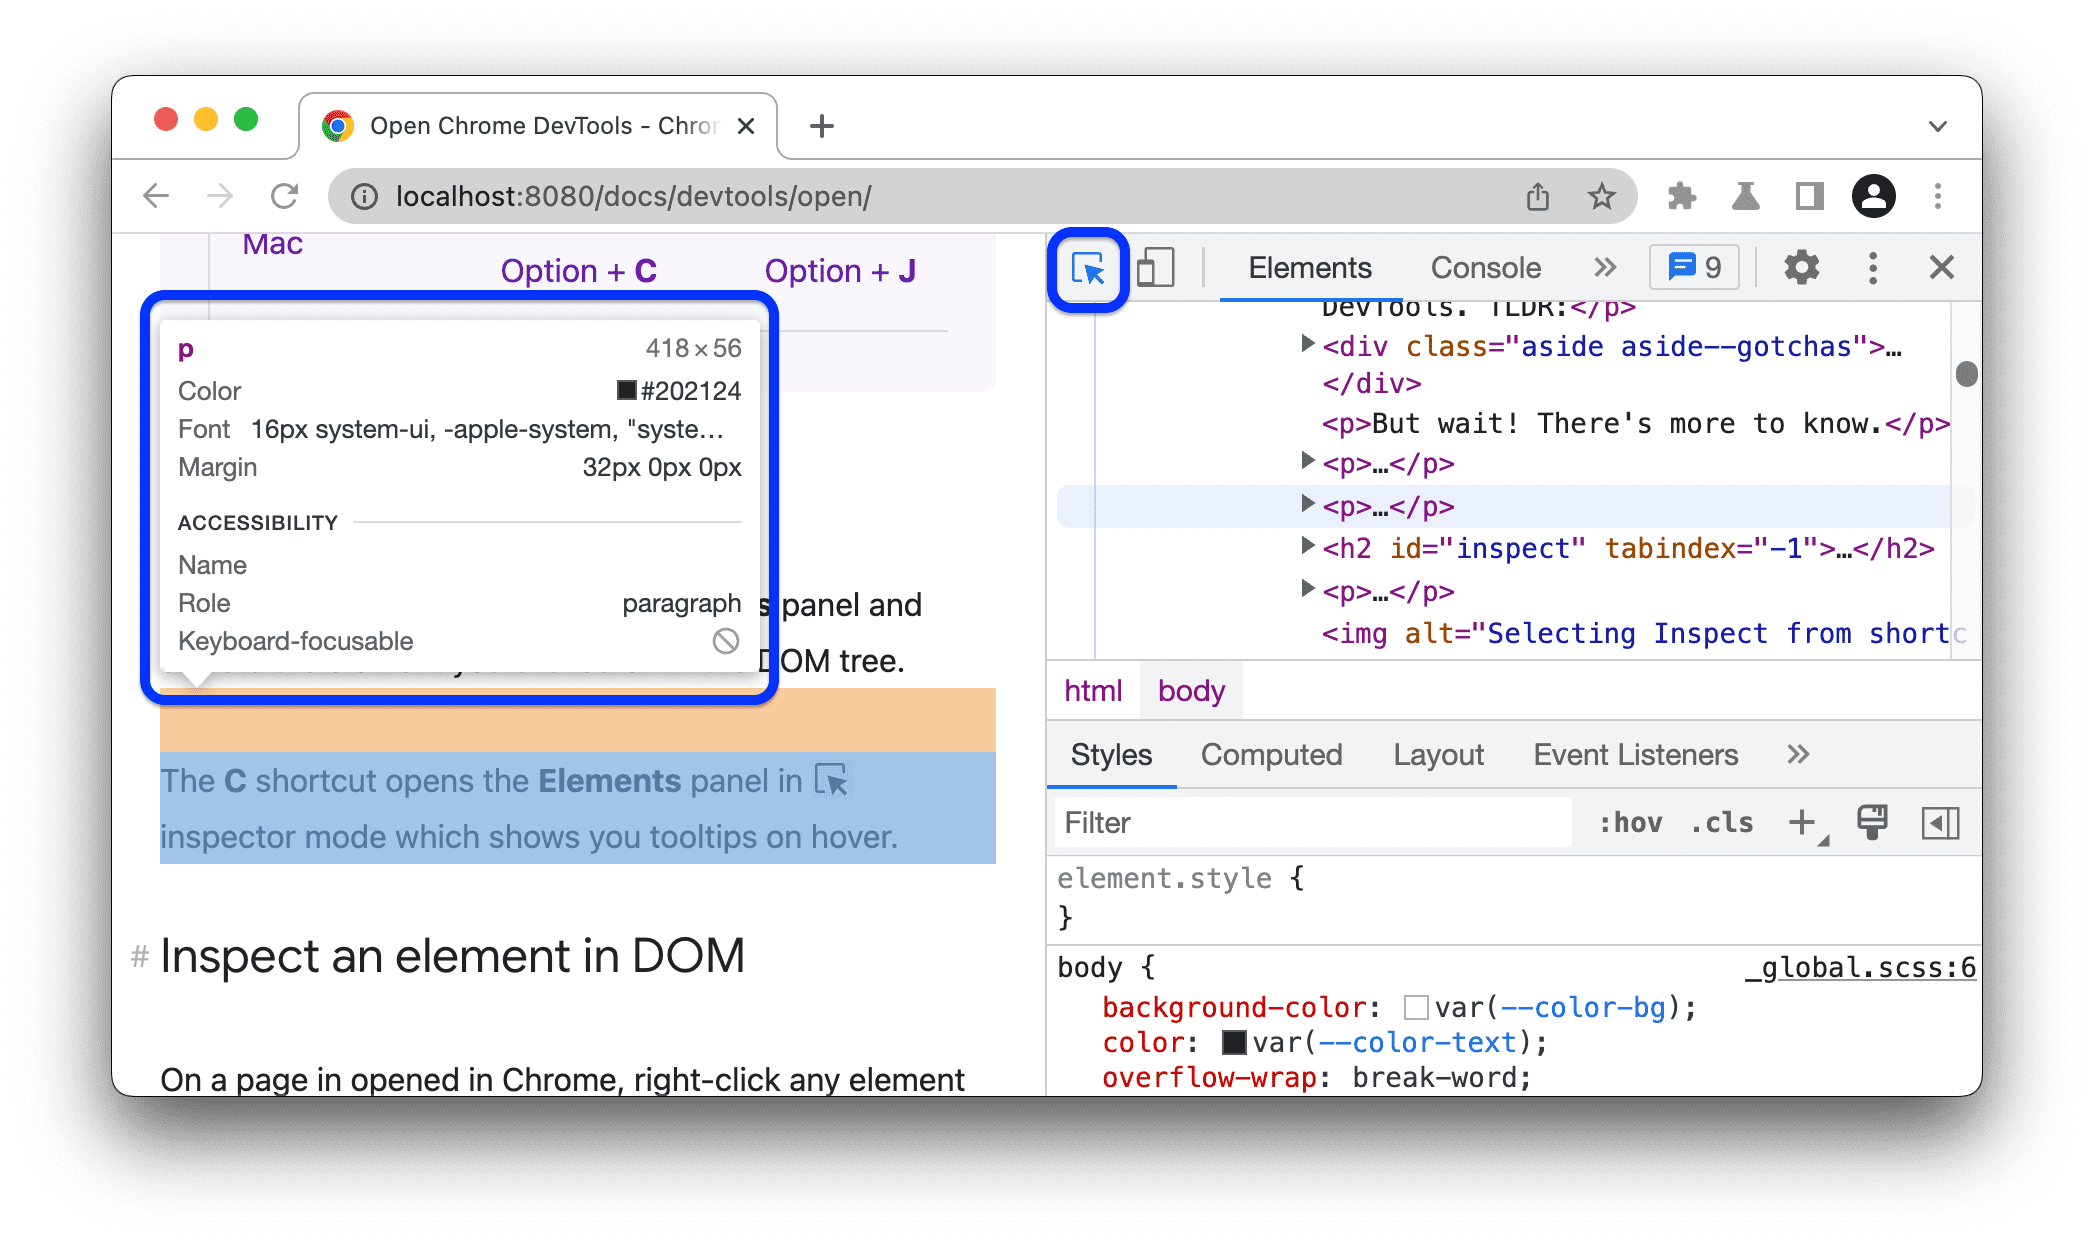
The Inspector: DOM explorer and CSS editor
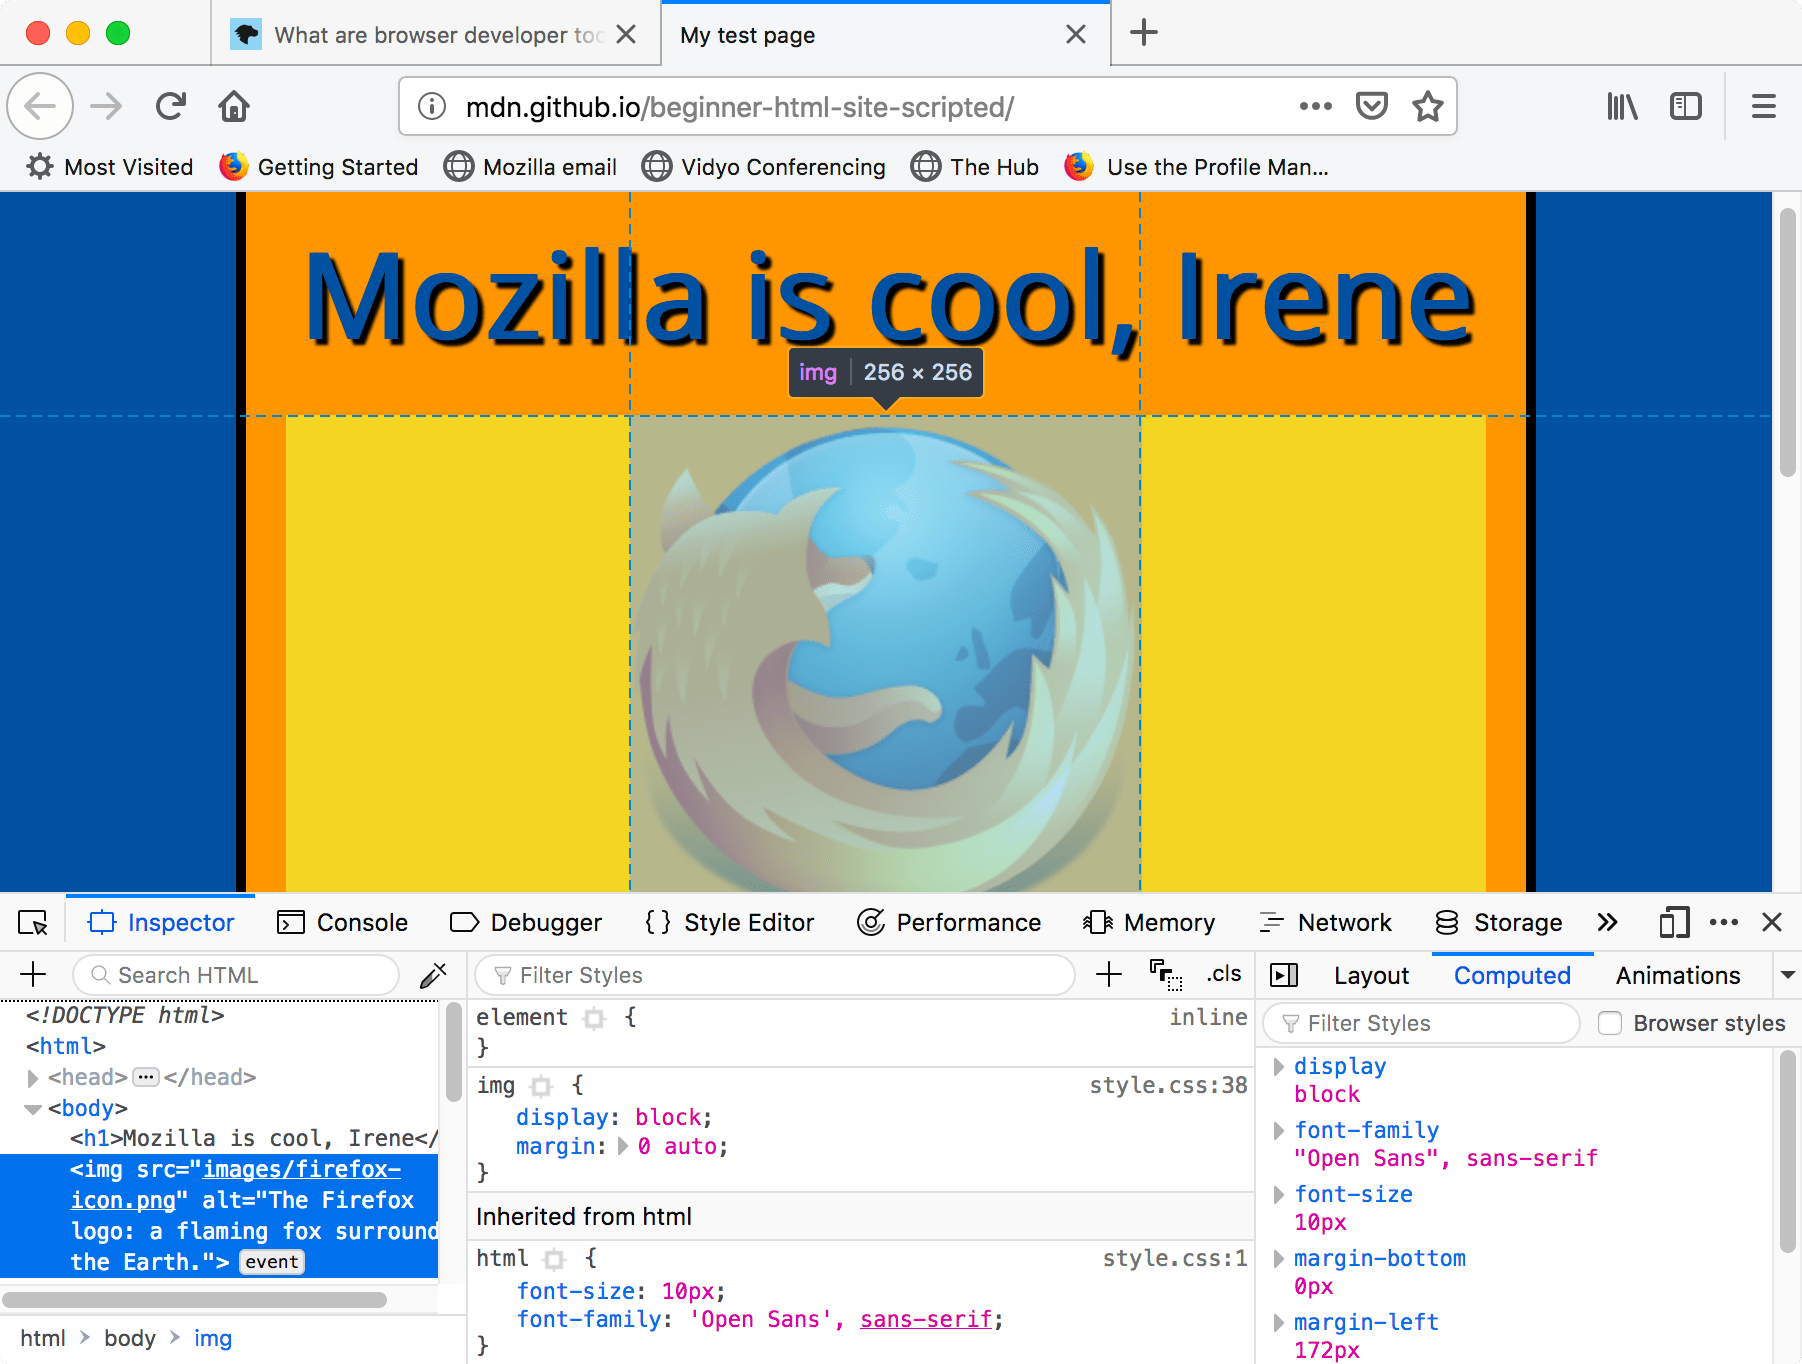
The Inspector is a fundamental component of browser developer tools that allows you to explore and manipulate the Document Object Model (DOM) of a web page. It provides a hierarchical view of the HTML structure, making it easy to understand how a webpage is constructed.
By using the Inspector, you can navigate through the DOM and inspect individual elements, their attributes, and styling properties. This allows you to gain valuable insights into the web page structure, helping you identify any issues or areas for improvement.
The Inspector also includes a CSS editor, which enables you to modify and experiment with CSS styles in real-time. This means that you can make changes to the CSS code and instantly see the visual effects on the web page. It's a powerful tool for tweaking designs, diagnosing layout issues, and testing different visual presentations.
With the Inspector, you can select specific elements on the web page and modify their CSS properties, such as colors, fonts, margins, and more. This real-time CSS manipulation allows you to fine-tune the design and achieve the desired look and feel.
Whether you're a web developer or a designer, the Inspector is an indispensable tool to have in your arsenal. It empowers you to understand the structure of web pages and make changes to the CSS code, ultimately enhancing the overall user experience. By leveraging the Inspector's DOM explorer and CSS editor, you can create visually stunning and well-structured web pages that captivate and engage your audience.
See what they built the website with
Have you ever wondered what technologies were used to build a particular website? With browser developer tools and also browser extensions like WhatRuns, you can easily find out. The network panel in Chrome Developer Tools provides insight into the technologies powering a website. By inspecting the server headers, you can identify the server technology used to deliver the site. Furthermore, the network panel reveals the JavaScript libraries and frameworks loaded by the website. This information can help you understand best practices, get inspiration for your projects, or even uncover potential security vulnerabilities.
How to Auto-open browser developer Tools on every new tab
If you frequently use browser developer tools, you can save time by configuring your browser to automatically open them whenever you open a new tab. In Chrome, go to the browser settings, navigate to the "On startup" section, and select "Open a specific page or set of pages." Then, click on "Add a new page" and enter the URL of the developer tools. Similar settings can be found in other browsers as well. By enabling this feature, you can have instant access to the developer tools whenever you need them, without the need for manual opening.
Exploring the CSS editors
The CSS editors provided by browser developer tools offer a wealth of features to help you manipulate and understand CSS styles.
The Styles panel is a key component of the CSS editor. It allows you to view both the declared styles, which are the styles applied directly to an element, and the computed styles, which are the final styles after taking into account inheritance and other factors. This panel provides valuable insights into how CSS affects the appearance of your web page.
But the Styles panel isn't just for viewing styles. You can also make live edits to CSS properties and instantly see the changes take effect. This live editing feature is incredibly useful for experimenting with different designs and quickly iterating on your CSS code.
To make your CSS editing experience even smoother, the CSS editors offer auto-completion suggestions. As you type, the editors provide suggestions based on the CSS properties and values, helping you avoid typos and find the right syntax faster.
The CSS editors also include color pickers, which allow you to choose colors visually instead of manually entering color codes. This makes it easier to find the perfect colors for your designs and ensures consistency across your web pages.
Whether you're a beginner or an experienced web developer, understanding how to effectively use the CSS editors can greatly enhance your web development experience. By experimenting with different styles, manipulating CSS properties, and leveraging the powerful features of the CSS editors, you can bring your web designs to life and create visually stunning websites.
The JavaScript debugger
Debugging JavaScript code is an essential skill for any web developer, and browser developer tools provide a robust JavaScript debugger to assist you. With the debugger, you can set breakpoints in your code, allowing you to pause the execution and inspect the values of variables and objects at that point. This enables you to closely examine the state of your code and identify any issues.
You can also add watch expressions to keep track of specific variables or conditions during runtime. With watch expressions, you can monitor the value of a particular variable or expression and ensure it behaves as expected. This is particularly useful when you want to track changes in your code and detect any unexpected behavior.
The call stack feature is another valuable tool provided by the JavaScript debugger. The call stack shows the sequence of function calls that lead to the current point in your code. By understanding the call stack, you can trace the execution flow and identify where the issue occurs. This helps you pinpoint the root cause of the bug and streamline your debugging process.
With the JavaScript debugger in browser developer tools, you have the power to effectively diagnose and fix bugs in your code. By leveraging breakpoints, watch expressions, and the call stack, you can gain deep insights into your JavaScript code and ensure it works as intended. Debugging your JavaScript code with the browser developer tools is an essential step in building robust and error-free web applications.
What's new in browser developer tools
Browser developer tools are constantly evolving, with new features and updates being released regularly. Staying up-to-date with the latest advancements is crucial to staying at the forefront of web development. Both Chrome Developer Tools and Firefox Developer Tools frequently introduce performance enhancements, new debugging capabilities, and improved UI/UX.
For Chrome, recent updates have focused on optimizing website performance, allowing developers to identify and resolve performance bottlenecks more efficiently. The latest features include improved network analysis tools, enhanced JavaScript debugging capabilities, and a revamped user interface for better usability.
Firefox Developer Tools have made great strides in providing a seamless development experience. Major updates have introduced new performance tools, such as the Network Monitor and the JavaScript Profiler, empowering developers to optimize website speed and responsiveness. Additionally, the latest Firefox Developer Tools offer an upgraded CSS Grid Inspector, making it easier to design and debug complex layouts.
By staying informed about these updates, you can take advantage of the latest tools and techniques to streamline your workflow, optimize website performance, and deliver exceptional user experiences. Embrace the power of browser developer tools and explore the latest features to enhance your web development journey.
Browser Developer Tools Tips
Maximizing your productivity and efficiency while using browser developer tools is essential for streamlining your web development process. In this section, we'll provide you with valuable tips and tricks to make the most out of these powerful tools.
1. Productivity Shortcuts
Speed up your workflow by mastering keyboard shortcuts. Instead of relying on menu options, use shortcuts to quickly access commonly used features. For example, in Chrome Developer Tools, you can open the console panel by pressing Ctrl+Shift+J (Windows) or Cmd+Option+J (Mac).
2. Useful Snippets
Save time by creating and utilizing code snippets. Snippets are reusable pieces of code that can be easily inserted into your web projects. Whether it's a commonly used CSS style or a JavaScript function, snippets can help you avoid writing the same code multiple times. In Chrome Developer Tools, you can access snippets from the Sources panel.
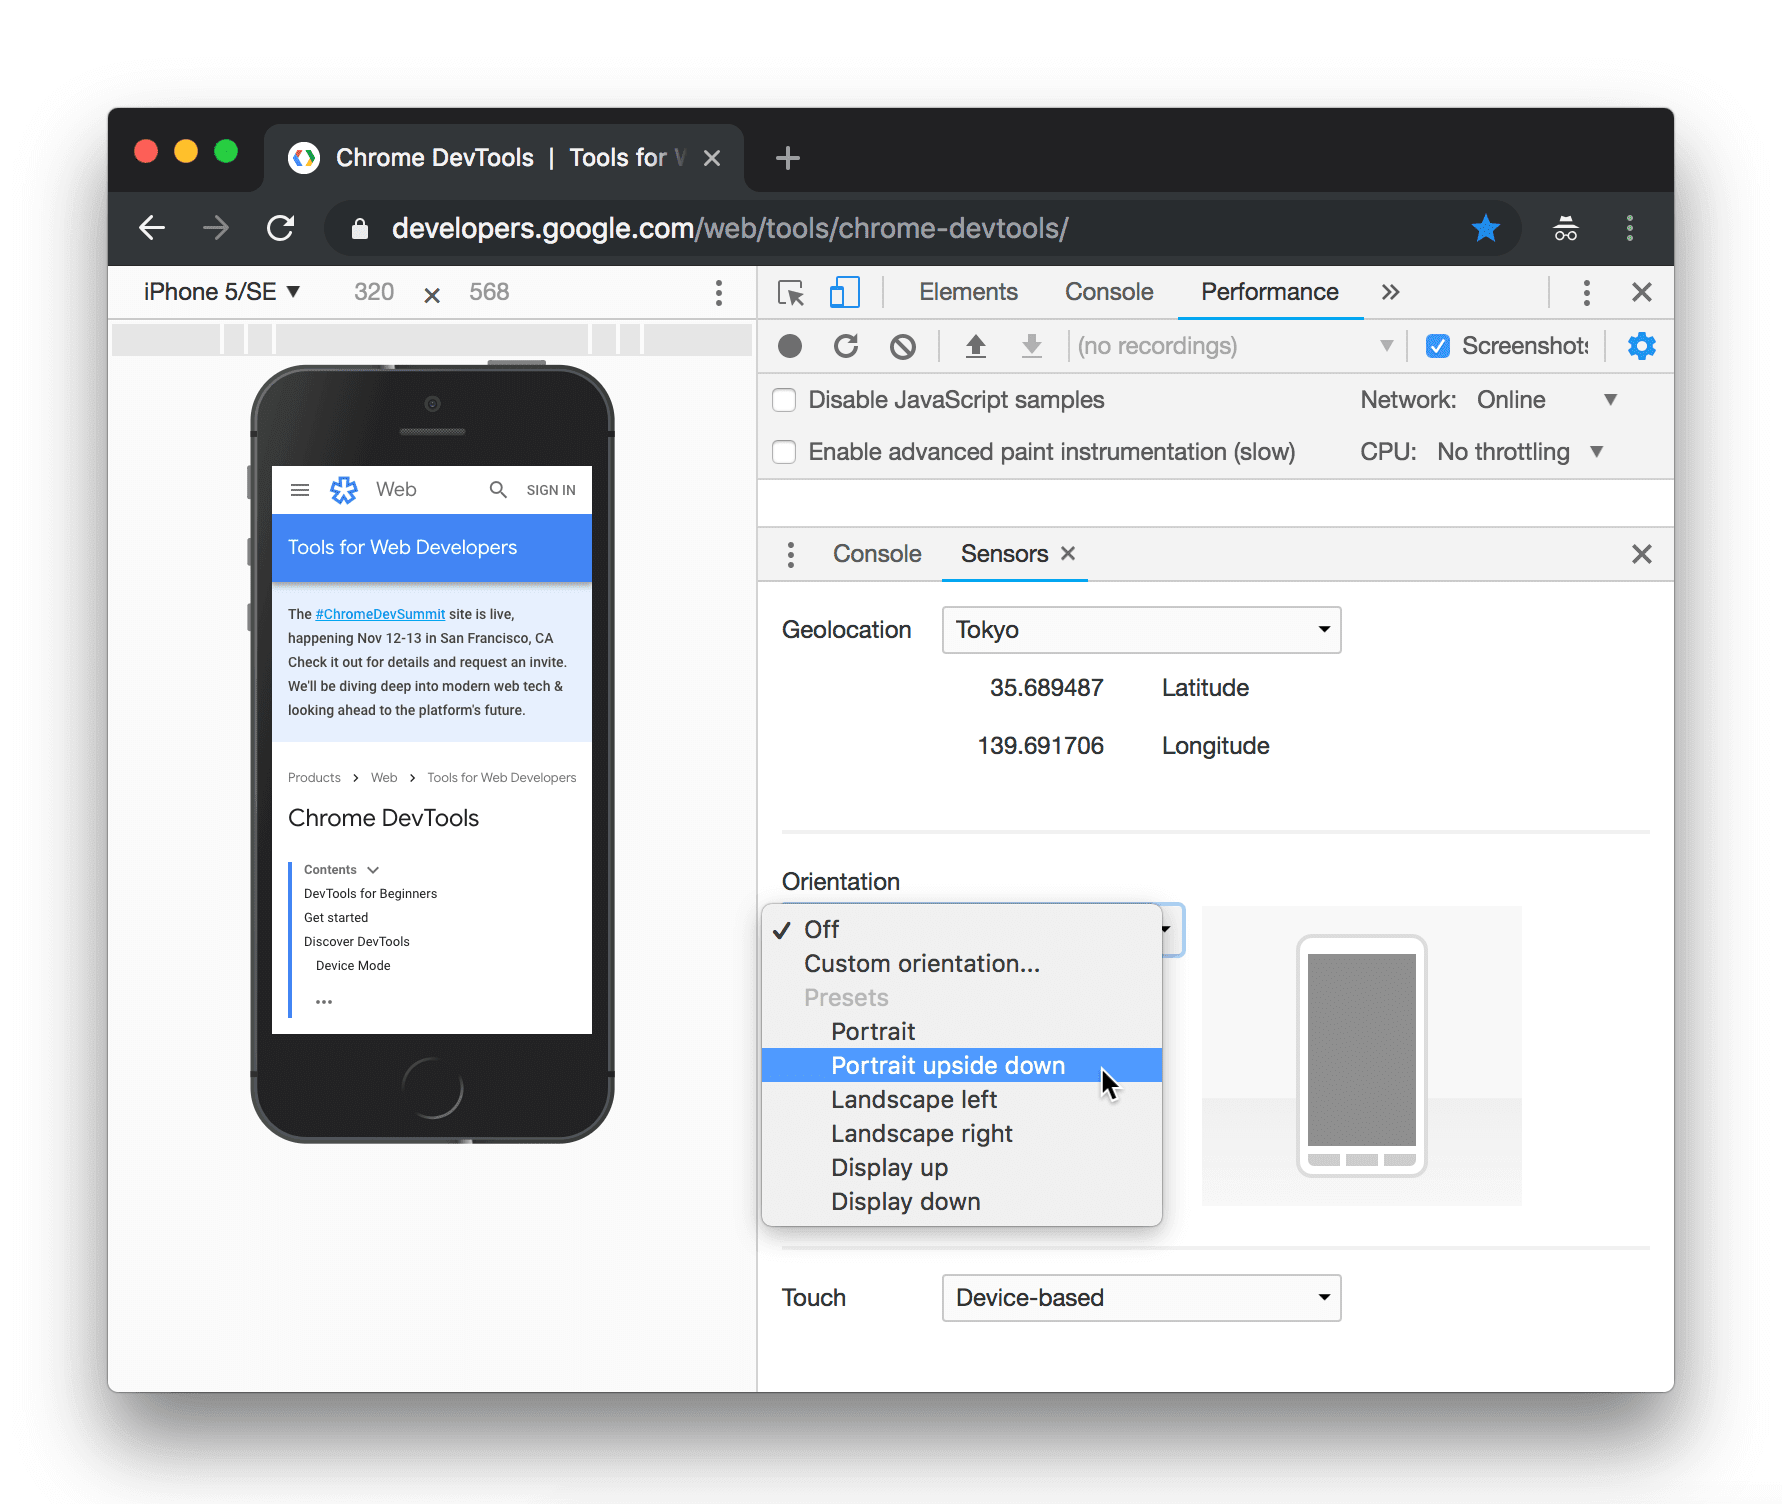
3. Network Throttling
Simulate different network conditions to test the performance of your website. Developer tools allow you to throttle your network speed, mimicking various connection types such as 3G, 4G, or even slower speeds. By analyzing how your site performs under different conditions, you can optimize it to provide a smooth experience for all users.
4. Inspect and Edit in Real-Time
Utilize the real-time editing capabilities of browser developer tools to experiment with different styles and layouts. With the inspector panel, you can inspect and modify elements on a web page, allowing you to see immediate changes and fine-tune your designs without having to switch between your code editor and browser.
5. Performance Optimization
Take advantage of the performance analysis tools in browser developer tools to optimize your website's speed. Use features such as the Performance panel to identify and resolve performance bottlenecks. Analyze network requests, assess loading times, and make necessary optimizations to enhance the overall user experience.
By implementing these tips and tricks, you can leverage the full potential of browser developer tools, making your web development process more efficient and enjoyable.
Conclusion
Browser developer tools are essential for maximizing your workflow and enhancing your web development process. These powerful tools empower web developers and designers to inspect, debug, and optimize websites with ease. By utilizing the tips and tricks provided in this guide, you can unlock the full potential of browser developer tools and take your web projects to the next level.
From exploring the structure of web pages through the DOM to debugging JavaScript code, browser developer tools offer a wide range of capabilities. With these tools, you can efficiently analyze and modify CSS styles, identify and resolve performance issues, and gain insights into the technologies behind any website.
Embrace the power of browser developer tools and stay up-to-date with the latest features and updates. By familiarizing yourself with these tools and incorporating them into your workflow, you can maximize your productivity, streamline your development process, and create stunning web projects that deliver exceptional user experiences. Remember, web development is an ever-evolving field, and by harnessing the capabilities of browser developer tools, you can stay ahead of the curve and achieve remarkable results.
FAQ
What are browser developer tools?
Browser developer tools, also known as devtools, are a suite of powerful tools integrated into every modern web browser. These tools allow developers and web designers to inspect, debug, and modify web pages in real-time.
What are some common uses of Chrome Developer Tools?
Chrome Developer Tools offer a wide range of capabilities, but there are five common uses that every web developer should be familiar with. These include inspecting and modifying elements on a web page, viewing and modifying CSS styles, testing and debugging JavaScript code, analyzing network requests, and optimizing website performance.
How do I open browser Developer Tools on my desktop browser?
Opening browser developer tools on your desktop browser is a straightforward process. In Chrome, you can access the tools by right-clicking on a web page and selecting "Inspect" from the context menu. Alternatively, you can use the keyboard shortcut Ctrl+Shift+I (Windows) or Cmd+Option+I (Mac).
How do I open browser Developer Tools on mobile?
Opening browser developer tools on a mobile browser is slightly different from the desktop experience. In Chrome for mobile, you can access the tools by tapping the three-dot menu in the top-right corner, selecting "More Tools," and then choosing "Developer Tools."
What is the Inspector in browser developer tools?
The Inspector is a fundamental component of browser developer tools that allows you to explore and manipulate the Document Object Model (DOM) of a web page. It provides a hierarchical view of the HTML structure and includes a CSS editor for real-time CSS manipulation.
How can I see what technologies were used to build a website?
With browser developer tools, you can easily find out. The network panel in Chrome Developer Tools provides insight into the technologies powering a website. By inspecting the server headers, you can identify the server technology used to deliver the site. Furthermore, the network panel reveals the JavaScript libraries and frameworks loaded by the website.
How can I auto-open browser developer tools on every new tab?
If you frequently use browser developer tools, you can configure your browser to automatically open them whenever you open a new tab. In Chrome, go to the browser settings, navigate to the "On startup" section, and select "Open a specific page or set of pages." Then, add the URL of the developer tools.
What can I do with the CSS editors in browser developer tools?
The CSS editors provided by browser developer tools allow you to view and modify both the declared styles and the computed styles of an element. You can make live edits and instantly see the changes take effect, experiment with different designs, and leverage features like auto-completion and color pickers.
What is the JavaScript debugger in browser developer tools?
The JavaScript debugger is a powerful tool that allows you to set breakpoints in your code, pause the execution, and inspect the values of variables and objects at that point. You can also add watch expressions to track specific variables or conditions during runtime and use the call stack feature to understand the execution flow.
What's new in browser developer tools?
Browser developer tools are constantly evolving, with new features and updates being released regularly. Both Chrome Developer Tools and Firefox Developer Tools frequently introduce performance enhancements, new debugging capabilities, and improved UI/UX.
What are some tips for using browser developer tools more effectively?
In this section, you'll find valuable tips and tricks for using browser developer tools more effectively. These include productivity shortcuts, useful snippets, and techniques for simulating various network conditions.